How to Reduce AWS Lambda Cost with Golang Profiling | DevRev
11 min read
—
Category
AWS Lambda Function costs are directly related with how much memory and CPU power are provisioned. In this post, we will look at a concrete example of an AWS Lambda written in Go Language (Golang) and how we can use Golang profiling tools to improve its performance and reduce cost.
After reading the article you will know about:
- AWS Lambdas and what their cost is.
- Enabling Golang profiling in your programs.
- Interpreting the CPU and memory profiles of your program.
- Golang profiling by using the built-in go tools pprof command.
Background
At DevRev we provide our users with the ability to transfer data from their existing System Of Record (SOR) to Computer, by DevRev. The functionality is an implementation of an Extract-Transform-Load process (ETL). It is currently available as an on-demand initiated process (a periodic 2-way sync is in the works, stay tuned 😃).
The components of the ETL are deployed as AWS Lambdas. They are ideally suited for functionalities that do not need to run continuously: they spin up on demand as events arrive and when they are not active they only incur the storage cost for the binary.
So, the lambdas are always cost-efficient in terms of run-time, however, when active, their cost differs based on the provisioned memory and processing power. The full table can be found here, but here a few current entries, that will be useful for our analysis later on:
From the table it can be seen that the price and provisioned memory are roughly linearly related. An AWS Lambda that requires twice as much memory also costs about twice as much.
Note that the table only lists the provisioned memory. Actually, the AWS lambdas only take this setting. The CPU power is scaled accordingly, so an AWS Lambda with more memory will also have more processing speed.
Base Measurements
In the following sections, we will take a look at a concrete example of an AWS Lambda used for the Extract part of the ETL process.
The extractor lambda, written in Golang, uses REST API calls to obtain data from the source system of record and stores that data on permanent storage. In the tests, we will extract approximately 10,000 large JSON objects from the source system. To make the tests completely fair, we will always extract the same 10,000 JSON objects.
Let’s first see what the AWS X-Ray currently reports:
The AWS X-Ray is another powerful tool, provided by AWS, to trace the execution of the events within the lambdas and comes with an SDK to annotate the execution.
In this post, however, we will only be using its end-of-execution report for the lambdas to get the billed duration.
As can be seen from the results, the current Extractor Lambda is set to use 1024 MB memory and extracts the 10,000 JSON objects in approximately 23 seconds. But, what we can also see is that the max memory used is way below the provisioned memory: the extractor only needs a fraction of that.
The AWS Lambda’s memory provisioning can be set only in steps of 128 MB, so the first lambda that would fit the functionality is the 256 MB one.
Well, that sort of works.
We reduced the memory size by a factor of 4 and the billed duration only increased by a little more than a factor of 2. So, reduce the setting, save half the cost and go celebrate?
Not quite yet.
Even if we set out to save costs, we would still like to provide the same experience to our users. Double billed duration in the face of quartering memory size may be OK in terms of costs but it’s definitely not OK in terms of user experience.
So, let’s see what we can do to save some cost as well as provide the same experience.
Cost AND Experience
Before we dive deeper into the profiling and code analysis, let’s take one more look at the results.
The first thing to note is that the max memory used is the same as the provisioned memory. This can occur if the lambda function is really close at using up all of its memory. Written in Golang, the extractor is equipped with the garbage collector, so it is likely that some of the delay is caused by the GC activating often, blocking execution and clearing the space just in time for the new objects.
The second thing to note about these measurements is that the memory consumption increased quite a bit in comparison with the 1024 MB lambda. Since the latter also has more CPU power this can mean that the 256 MB lambda simply has more data “in-flight” because it is not able to process it quickly enough.
The thing is, however, that the extraction process is not supposed to be computationally heavy. All it does is to take the data, returned from source SOR through a REST API call, and store it into permanent storage.
Where does all the CPU processing go? If we already know that GC is hard at work, what can we do to decrease the allocated memory?
To answer these questions, let’s turn to profiling, a long established process for performance analyses of programs, with great support in Golang.
Profiling an AWS Lambda
The Golang profiling is available for a few profiles (see here) but in this post we will be mostly focusing on the CPU and memory profiles. Do note that this is biased because of the nature of the problem we are demonstrating: the increased time might just as well have been revealed by a block profile (if the program is blocked by I/O or something similar) or mutex profile (if there is mutex protected resource contention).
To enable profiling we will have to change the code a little bit. The instructions on how to do that can be found here.
What’s special about profiling in lambdas, though, is that they don’t have any permanent storage available. They do have an ephemeral/tmp storage, which is by default at 512 MB and is more than enough for the profile data. This can then be used to store the profiles during execution and then we can upload them to permanent storage (like S3).
Let’s make another run of the extractor and this time with CPU profiling enabled.
The CPU Profile
The way the CPU profiling works is that it periodically pauses the execution of the program (by default 100 times per second) and records the stack traces of all the running goroutines. This is called a sample. After the sample is collected and written to the output, the program will resume.
Note that this does affect the timing of the program (so other profilers should not be run at the same time as CPU profiling). The output of the CPU profiling is a file called a CPU profile.
The CPU profile file is best opened with a profile analysis tool. The tool pprof is actually already part of the Golang tools, which means, that you can simply run:
For the tool to find the right binary and associated source code automatically it should be run in the same directory that also has the entry-point (main function) of your executable.
If all goes well, you should see something like this:
Normally, I would recommend just using the default setting for the nodecount. However, this tool can be useful if there is too much clutter or if you are preparing something that can be viewed by an audience (even somewhat).
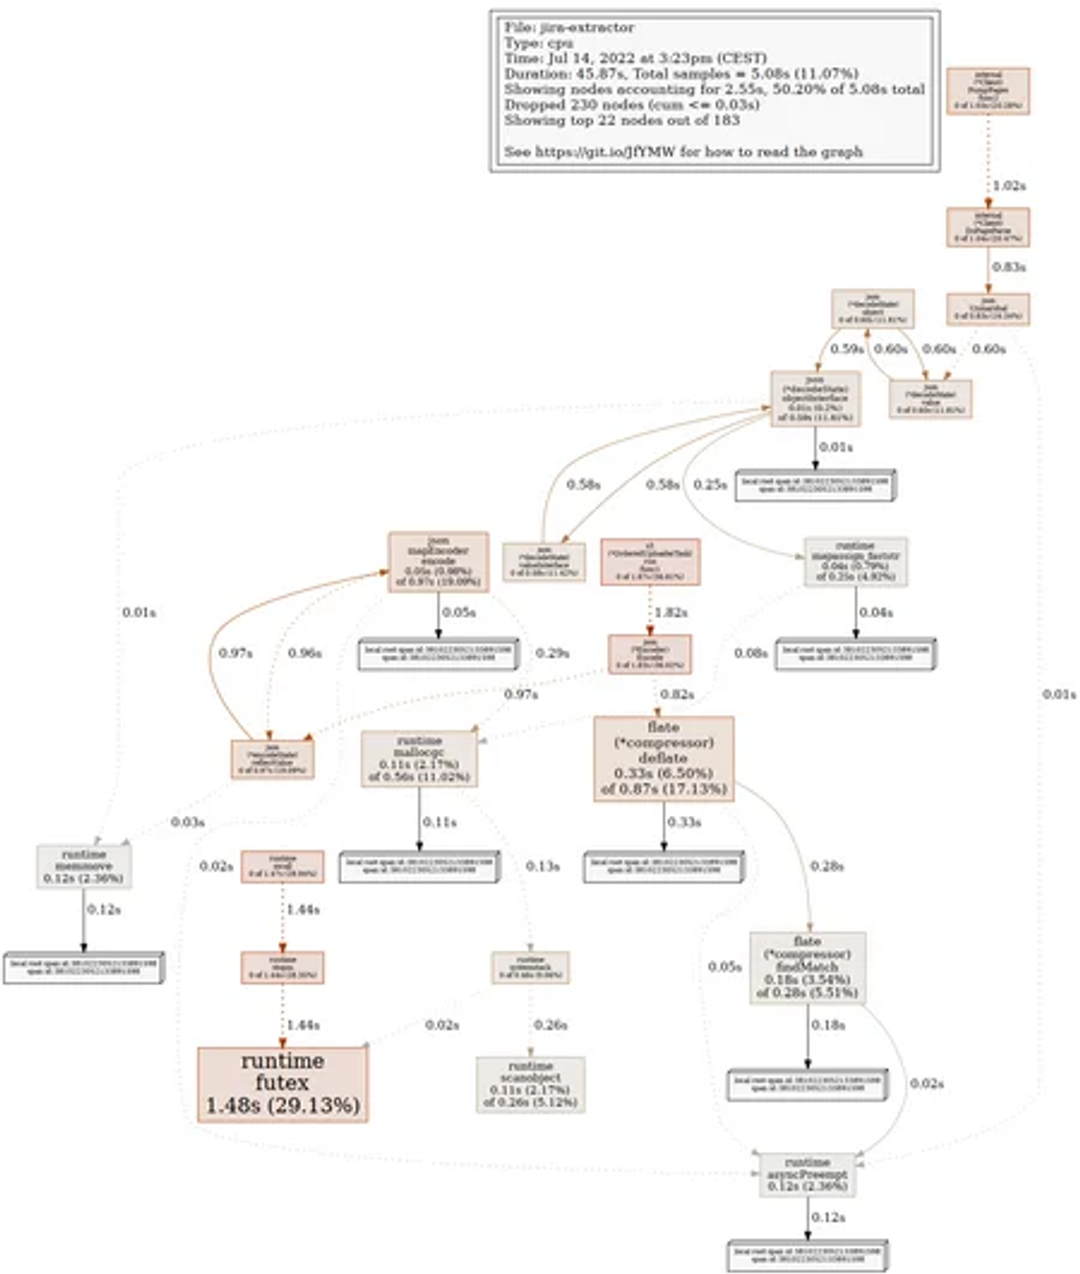
And so, here is the generated png file:

If this is the first time you see the pprof graph it can be daunting, but let me assure, it will all become clear:
- The large boxes are the functions that the CPU was found executing
most often - The boxes pointing to the large boxes are the ones that initiated
the functionality - Through every box, peek into the stack and observe how much time is
spent in called functions. It’s as if each box holds a digital
record of its presence across multiple layers.
From this knowledge, we can derive that:
- Runtime.mcall is present often. That function is part of the internal go scheduler and so it might be perfectly fine that it’s doing a lot of work. It needs to switch between the various goroutines that the Lambda function is using.
- Something called OrderedUploaderTask.run is spending a lot of time in compression and encoding JSONs. This is an implementation within the Extractor that uploads the extracted JSONs to a permanent store. The fact that the data is compressed is not something that is negotiable, however maybe we could reduce time spent in encoding.
- The PumpPages function also seems to spend a lot of time in unmarshaling the received JSON data. Perhaps we can tackle the problem of encoding/decoding JSONs at the same time.
- The encoder and decoder of the JSONs also seem to cause the runtime.mallocgc to be frequently invoked. So, these two functionalities are not only spending CPU time they are also causing a lot of allocations that could perhaps be avoided.
Now that we know that we have to check allocations and memory use more closely, let’s rerun the Extractor lambda again with the memory profiling enabled (and CPU disabled).
The Memory Profile
The Golang runtime keeps track of all allocated objects at all times to support its GC functionality. The way this is most often used, if you have a long running service, is to expose an endpoint and query the allocated memory periodically. With AWS lambdas that would be a bit harder to do. What we can do is to get the final report at the end of the lambda execution, so we will not be looking at the currently allocated memory but rather the places where most allocations occur.
To open the memory profile, we can use the exact same command we used for the CPU profile, just using a different file:
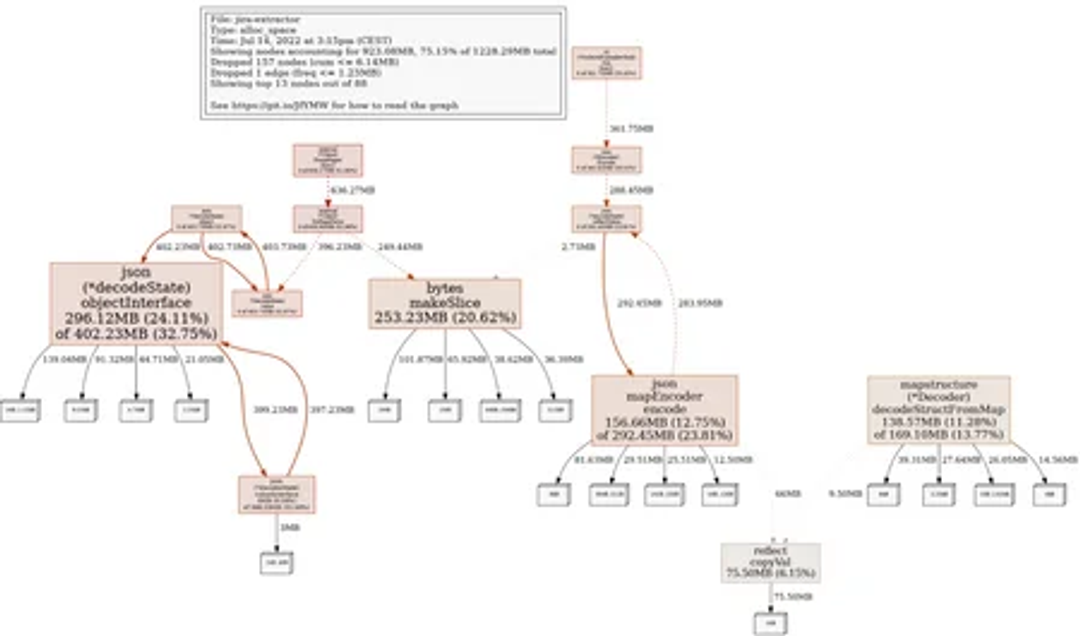
The generated png looks the following image.

The graph can be interpreted as the CPU profile graph. In addition to what we already discovered with CPU profiling, we can also note that:
- There are bytes.makeSlice calls that allocate a lot of memory, and
- There are calls to decodeStructFromMap from mapstructure that also allocate quite some memory.
To provide an alternate view, we can also look at the source code listing for the offending function, the DoPageParse. We will look at it from the cumulative perspective because, as can be seen from the graph, it does not allocate memory itself. The called functions are doing that.
From this output we can see that the function first reads the REST response body into a buffer and then parses it into a structure.
Let’s move into our next steps.
Diving into Anaylsis
The intermediate buffer was initially included to handle rare occasions where the source SOR would return an OK HTTP response but not a valid JSON. However, this situation has been confirmed as incredibly unlikely through testing and no longer requires such provisioning; thus, eliminating the need for said intermediate buffer.
Parsing into a structured format is logical for our goal. After storing the data in memory, we must pass it on to be retained permanently. Some of these records will feed Extractor functions; hence deserializing them as map[string]interface{} was beneficial and necessary. Nonetheless, only specific fields are needed from the returned JSON – so rather than retaining an immense amount of extra information needlessly let’s reconfigure what gets parsed and keep other elements stored simply as json RawMessage (represented by byte arrays).
By already parsing the structure, we can omit the mapstructure functionality. This allows us to take select fields directly from a map[string]interface{} and put them into an organized structure that’s type-checked instead of just fetching it generically via a generic interface storehouse.
Our initial adjustment was simple - just delete the buffer in between. But to guarantee that other tools worked seamlessly with json.RawMessage, we had to spend a bit more time on our second alteration; nevertheless, this did not require an overhaul of any kind and could be implemented rapidly.
With these changes applied, let’s check the X-Ray results again.
These results are now much better!
The 512 MB Lambda is now on-par with the 1024 MB lambda but the 256 MB lambda still takes substantially longer.
By analyzing our peak memory consumption, we can experiment with employing the most compact lambda available to get optimal results.
Not Bad For a Day’s Work
In a single day, we’ve managed to deliver the same performance and functionality at half the cost by simply changing up our technology stack. We can always strive for more improvements - but this quick win is still something that’s worth celebrating!
Related Articles

DevRev Editorial

Ahmed Bashir

Patrick van de Werken

Vishal Narendar
Computer+ Apps
Our customers
Initiatives
